· 4 min read
Debug a React app with Visual Studio Code
Visual Studio Code has an integrated debugger, easy to use and works pretty much with everything!
Debugging a React app is far from being an easy task… if you don’t know the tools you already have, for free!
Today we’ll see one of the many, that is the Visual Studio Code debugger.
I recorded a short demo here:
Setup
Unfortunately there’s a little setup required, which is… literally 3 clicks!
- Go on the “Run and Debug” tab of vscode
- Click on the text “create a launch.json file”
- Select “Web App (Chrome)” from the dropdown
And that’s it!
This will create a file called launch.json inside the .vscode folder of your project, similar to this:
{
  // Use IntelliSense to learn about possible attributes.
  // Hover to view descriptions of existing attributes.
  // For more information, visit: https://go.microsoft.com/fwlink/?linkid=830387
  "version": "0.2.0",
  "configurations": [
    {
      "type": "chrome",
      "request": "launch",
      "name": "Launch Chrome against localhost",
      "url": "http://localhost:8080",
      "webRoot": "${workspaceFolder}"
    }
  ]
}
Run the debugger
With that set, technically you’re ready to go by pressing F5.
What could go wrong here? Mainly two things:
You’re not running your app on port 8080
Make sure to set the correct port in the url field of your launch.json file. The default seems to be 8080, but it’s not always the case.
If for example you’re using vite, it should be 5173 or if you’re using crate-react-app then it’s likely to be 3000.
In general, make sure to set there the right port you’re running your app on.
You’re not running your app
That’s even easier, just run your app with the command you usually use, for example npm run dev or npm run start.
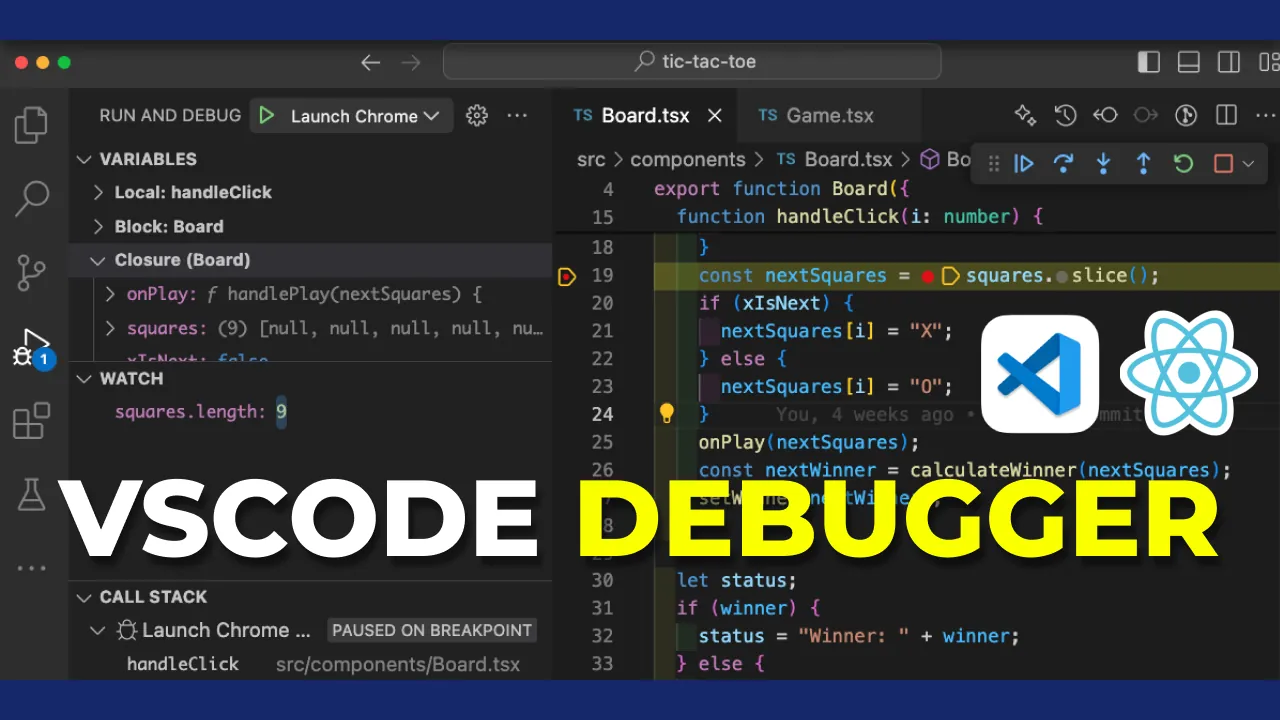
Breakpoints
At this point you have your app running and the debugger attached to it, but nothing happened so far. It’s time to set a breakpoint and see the magic happen!
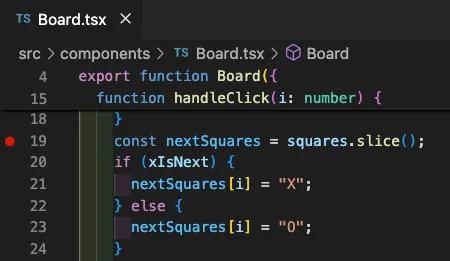
Just click on the left side of a line in the code and the red dot will appear, that’s a breakpoint.
If the application flow now passes into that line, the execution will stop there and you’ll be able to inspect the state of the application at that point.
Variables
The first panel in the Run and Debug tab is the Variables panel, which shows all the variables available at that point.
Variables are grouped by scope, you can easily inspect them, expand objects and arrays to see the content and… you can even change their value!
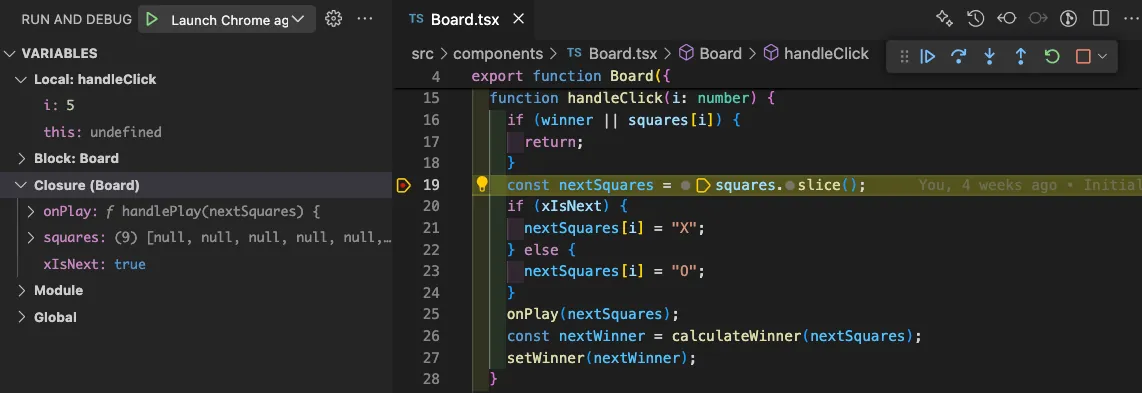
However, if for example you change something which should be visible in the UI, you won’t see it changing. Most likely the reason will be that since you’re currently paused on a line, the component is not re-rendered. Just keep going with the debugger and you’ll see the UI updating.
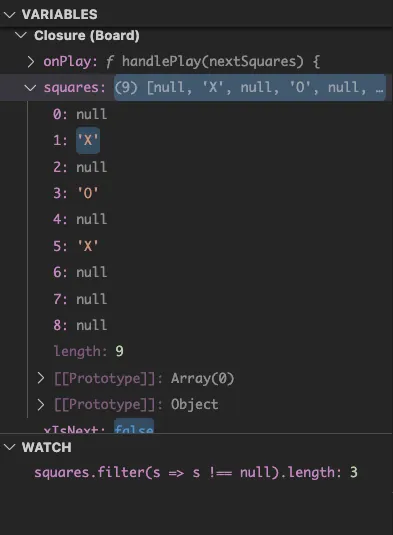
Watch
The Watch panel is similar to the Variables one, but it allows you to add custom expressions to watch.
For example, if in your application you have an array of squares and you want to see how many items are in there, you can add an expression like squares.length and it will be evaluated and shown in the Watch panel.
Similarly, if you want to keep track of the squares having a specific value, for example not null, you can add an expression like squares.filter(s => s !== null).length and again you’ll see the value updated as you go through the application, real time!
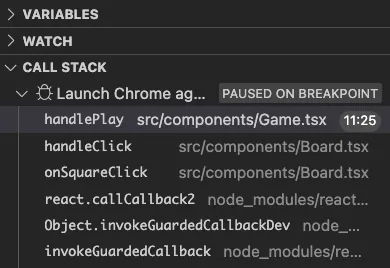
Call Stack
The Call Stack panel shows the current stack of function calls, which is useful to understand how you got to the current point.
Let’s say you’re in a function, who called that function? And who called the caller? You can find the entire stack here.
Breakpoints
The last panel is the Breakpoints one, which shows all the breakpoints you set in the code. You can activate/deactivate breakpoint there, or also disable them without losing them.
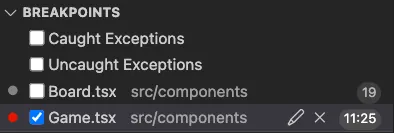
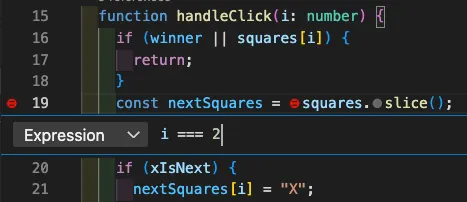
Conditional breakpoints
By hovering on a breakpoint you can see a little pencil icon, which allows you to make that breakpoint a conditional one.
The most common usecase is if you’re setting a debugger inside a loop, but you want to stop only when a specific condition is met and not at each iteration. There you have it, set the condition and you’re good to go!
Chrome DevTools
Anyway, in case you’re using Chrome, you actually have two debuggers ready to use. The one on vscode works great, but in case you’d like to have everything integrated in your browser, I also wrote an article on the Chrome debugger. You can read it here: Chrome Debugger is easier to use than you might think
Thanks for reading, happy debugging!

Hello! My name is Leonardo and as you might have noticed, I like to talk about Web Development and Open Source!
I use GitHub every day and my favourite editor is Visual Studio Code... this might influence a little bit my content! :D
If you like what I do, you should have a look at my YouTube Channel!
Let's get in touch, you can find me on the Contact Me page!